EEG Examples: Beta spindles and Low Voltage EEG
Beta spindles
Family studies have shown that frontal and fronto-central beta spindles and excess beta exhibit an autosomal dominant mode of inheritance in healthy persons, but these patterns can also occur as a result of brain damage. Furthermore, the pattern of fronto-precentral beta has a lower frequency in Japanese (Vogel, 1970). A strong linkage between beta frequencies and GABA-A receptor genes has been reported, in line with the often-reported medication effects of benzodiazepines resulting in a ‘beta buzz’ (Porjesz et al., 2002).
Spindling Excessive Beta or Beta Spindles are synchronous activity in the beta range centered around a specific frequency. Classically according to the neurological literature higher voltage beta is defined as exceeding 20 uV in amplitude.
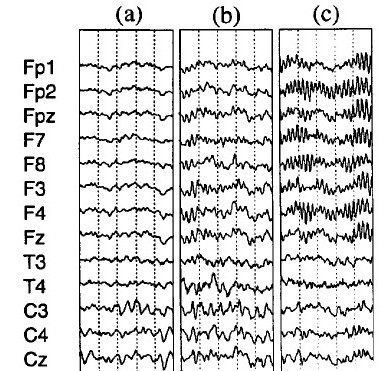
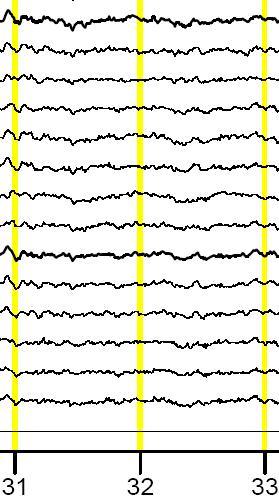
Figure 3: On the right 3 traces of EEG are shown where (a) is a normal EEG with posterior alpha and frontal desynchronized EEG. (b) shows Synchroneous beta activity frontal, this is rhythmic beta activity, but it does not show a spindling rhythm yet. (c) shows clear beta spindles frontal You can see this is rhythmic beta with a center frequency and it clearly stands out from the back ground activity. Figure from Clarke et al. (2001)
Below the data of a patient with ‘complex’ ADHD who did not respond to conventional treatments. This client has been treated with Neurofeedback both on downraining theta frontally and downtraining the beta spindle frequency at Cz in the 24-30 Hz range. Note the quite localized presence of the beta spindles pre-treatment. Pre- and post QEEGs show a clear normalization of the beta spindles. Client also improved clinically during the course of treatment.
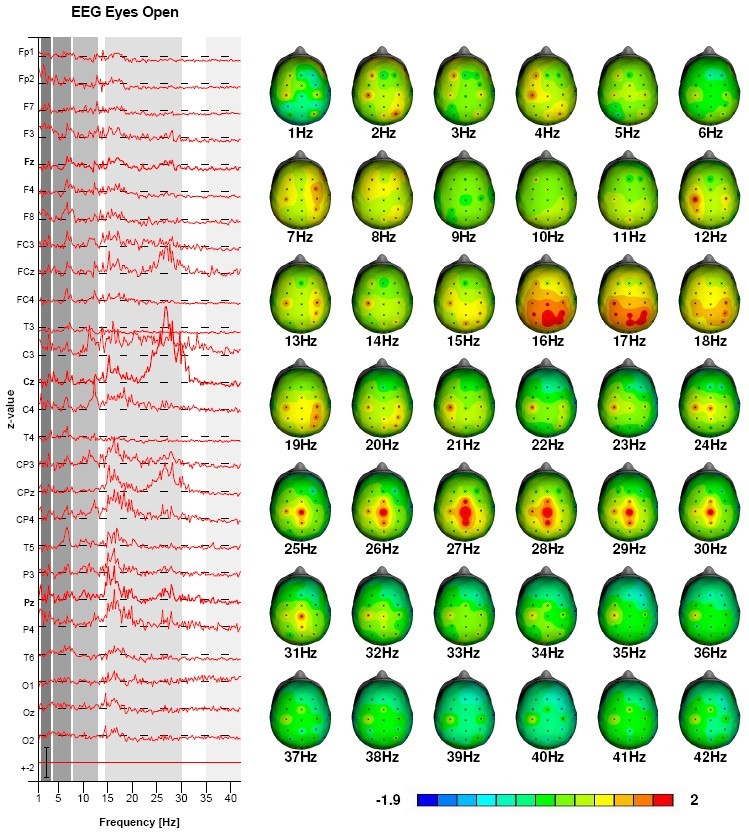
Pre-treatment QEEG: Beta-spindles 25-30 Hz
Figure 4: This figure depicts the QEEG pre-neurofeedback (top) and post-neurofeedback (below) in a patient with ADHD. Note the normalized beta-spindling.
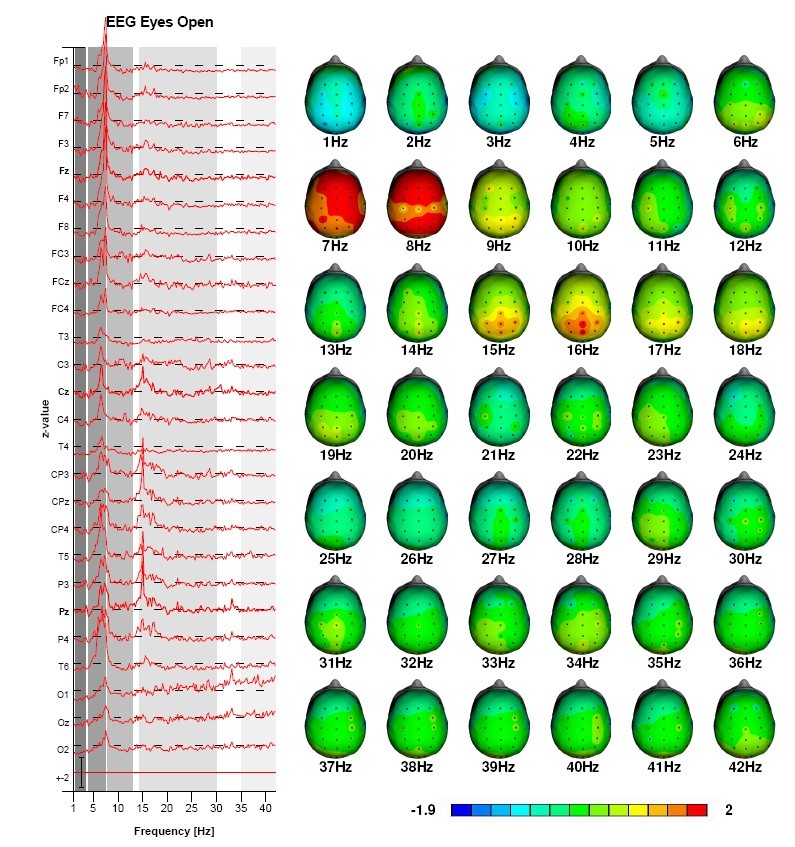
Post-treatment: Beta-spindles normalized
Excess beta sub-group and beta spindles
Excess beta or beta spindles make up 13-20% of the ADHD population (Chabot & Serfontein, 1996; Clarke et al., 1998; Clarke et al., 2001b). Several studies demonstrated that these patients do respond to stimulant medication (Chabot et al., 1999; Clarke et al., 2003b; Hermens et al., 2005). Relatively little is known about this excess beta group and about beta spindles. The latter are generally observed as a medication effect due to benzodiazepines (Blume, 2006) or barbiturates (Schwartz, Feldstein, Fink, Shapiro & Itil, 1971). Furthermore, Clarke et al. (2001c) reported this ADHD sub-group was more prone to moody behavior and temper tantrums and Barry et al. (2009) reported that the ERP’s of this sub-group differed substantially from ADHD children without excess beta, suggesting a different dysfunctional network explaining their complaints. Interestingly the ERP’s of the excess beta sub-group appear more normal than those of the ADHD sub-group without excess beta.
Originally Gibbs and Gibbs (1950) distinguished two types of predominantly fast EEG, a moderate increased beta, which they termed ‘F1’ and a marked increased beta, which they termed ‘F2’. Records of the F1 type were initially considered as ‘abnormal’ until the 1940’s, whereas since that time Gibbs and Gibbs only considered the F2 type as ‘abnormal’. However, currently electroencephalographers have shown a more lenient philosophy towards fast tracings (From: Niedermeyer & Da Silva (2004) page 161). At this moment the only abnormal EEG pattern in the beta range is the ‘paroxysmal fast activity’ or ‘beta band seizure pattern’, which most often occurs during non-REM sleep, but also during waking (Stern & Engel, 2004). This pattern is quite rare (4 in 3000) and most often seen in Lennox-Gastaut syndrome (Halasz, Janszky, Barcs & Szcs, 2004). Vogel (1970) also described an EEG pattern of ‘occipital slow beta waves’ or also termed ‘quick alpha variants 16-19/sec’ which responds in the same way as alpha to eyes opening and also has a similar topographic distribution. This pattern was only found in 0.6% of a large population of healthy air-force applicants, given it’s very low prevalence and occipital dominance, this subtype is unlikely the explanation of the ‘excess beta’ or ‘beta spindling’ sub-type observed in ADHD. Therefore, the ADHD sub-group with excess beta or beta spindling (assuming the paroxysmal fast activity has been excluded) can neurologically be considered a ‘normal variant’. However, neurophysiologically this can be considered a separate sub-group of ADHD, which does respond to stimulant medication (Chabot et al., 1999; Clarke et al., 2003b; Hermens et al., 2005). More research is required to investigate the exact underlying neurophysiology of this sub-type and if other treatments could more specifically target this excess beta or beta spindling.
Low-Voltage EEG (LVA)
This is the most well described EEG phenotype to date and was first described by Adrian and Matthews (Adrian & Matthews, 1934). The latter author exhibited an EEG in which alpha rhythm ‘…may not appear at all at the beginning of an examination, and seldom persists for long without intermission.’ (Adrian & Matthews, 1934: page 382). The low-voltage alpha EEG has been known to be heritable (autosomal dominant) and the heritability of alpha power is estimated at 79-93% (Anokhin et al., 1992; Smit et al., 2010; Smit, Posthuma, Boomsma, & De Geus, 2005; Vogel, 1970; Beijsterveld & van Baal., 2002). Low-voltage EEG is a well-described endophenotype in anxiety and alcoholism (Ehlers, Garcia-Andrade, Wall, Cloutier, & Phillips, 1999; Enoch, Schuckit, Johnson, & Goldman, 2003; Bierut et al., 2002; Enoch et al., 1999; Pine & Pine, 1953). Alpha power and LVA have been successfully associated with a few chromosome loci (Enoch et al., 2008) but also with single genes: a serotonin receptor gene (HTR3B) (Ducci et al., 2009), corticotrophin releasing binding hormone (CRH-BP) (Enoch, White, Waheed, & Goldman, 2008), a gamma-amino butyric acid (GABA)-B receptor gene (Winterer et al., 2003) and with the BDNF Val66Met polymorphism in depression (Veth, Arns, Drinkenburg, et al., in preparation).
Figure 1: This figure shows a typical example of a regular EEG (top) as compared to a Low-Voltage EEG (below).
The Low voltage fast pattern has been linked to alcoholism and GABA-A receptor genes (Porjesz et al., 2002) more specifically to gene number 4’s regulation over GABA receptors (Bierut et al., 2002). Other research has demonstrated a relation between low voltage EEG and low voltage ERP amplitudes, which are both more prevalent in alcoholism (Enoch et al., 2002).
To further test the hypothesis that low voltage EEG is related to decreased GABA-ergic function, we conducted a small experiment. According to the literature, alcohol intake should lead to increased beta and increased theta based on averaged group data (Stenberg et al., 1994). Alcohol exerts most of it’s effects through the GABA-ergic system. However, based on the above literature and the EEG Phenotype paper we hypothesized that alcohol – by it’s GABA-ergic function – should specifically lead to increased alpha in healthy subjects with a low-voltage fast EEG . The increased GABA-ergic activity should reinstantiate the alpha rhythm again in these subjects by hyperpolarization of thalamic neurons.
Below see the data from 1 healthy subject after increasing doses of Vodka. These are the Z-score maps for the alpha band during Eyes Closed. It can be clearly seen that this can be considered a low voltage EEG, with hardly any alpha. T=0 is the pre-assessment without alcohol intake. T=1; T=2 and T=3 represent increasing doses’ of vodka, where T=3 is after 0.4 litre of pure Vodka. In this figure it can be clearly seen that when the dose of ethanol increases alpha starts re-appearing. In the highest dose one also sees a slowing of the alpha into the 8-9 Hz. No consistent dose-response effects were seen for the other frequency bands.
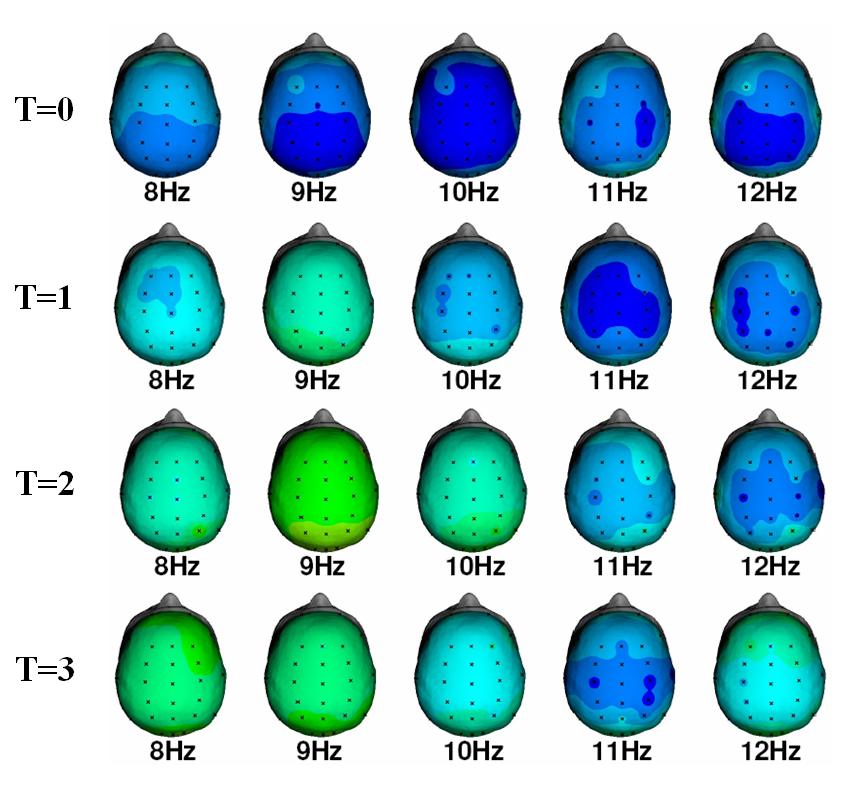
Figure 2: QEEG: Single Hertz Bins for the alpha band. Note the increase in spectral content at 9 Hz with increasing doses of alcohol and the further slowing of alpha at T=3.
This example clearly demonstrates the need for Personalized Medicine, as the effect of ethanol on individuals with specific EEG phenotypes is clearly different as based on published group studies (the same as with ADHD). Also, given the literature behind the low voltage EEG phenotype and it’s linkage to alcoholism makes the disorder more understandable, especially from a self-medication point of view. The neurofeedback treatment recommendation for this EEG phenotype consists of Alpha uptraining and SMR training.
The low voltage fast can be considered a normal variant, however a low voltage slow EEG is usually considered a diffuse and non-specific abnormality (make sure it is not due to drowsiness). For a more detailed description and more background info related to this subtype also see Johnstone, Gunkelman & Lunt (2005).