History of neurophysiological findings in depression
Depression history of EEG and QEEG findings
Major depression is a common disorder with millions of sufferers around the world and a lifetime prevalence of about 13% in men and 21% in women (Blazer, Kessler, McGonagle & Swartz, 1994). The World Health Organization has predicted that depression will globally become the 2nd largest burden of disease by 2020, following cardiovascular conditions (Murray & Lopez, 1997). Individuals with depression experience a wide range of symptoms including a loss of interest or pleasure, feelings of sadness, guilt, low self-esteem, disturbances in sleep and appetite, poor concentration and suicidal ideations (DSM-IV, 1994).
Depression history of EEG and QEEG findings
Lemere published the first description relating EEG findings to depression in 1936 (Lemere, 1936). After inspecting the EEG’s of healthy people and several psychiatric patients he concluded: “…The ability to produce “good” alpha waves seems to be a neurophysiological characteristic which is related in some way to the affective capacity of the individual”. This increased alpha power is to date still considered a hallmark of depression (for an overview also see Itil (1983)) and recent studies suggesting this endophenotype to be the mediator between the BDNF Val66Met polymorphism and trait depression (Gatt et al., 2008). A large body of research into alpha power in depression has been dedicated to ‘frontal alpha asymmetry’, which will be addressed in the next section.
Frontal alpha asymmetry in depression
In 1973 d’Elia & Perris were the first to investigate parietal alpha power asymmetry in depression (psychotic depression in this case) and reported that the left to right ratio correlated to the depression score both before and after ECT (d’Elia & Perris, 1973). Furthermore, the treatment effects of ECT were mainly reflected in left hemisphere changes.
In 1983 a group led by Richard Davidson started publishing pioneering work on frontal alpha asymmetry in depression. They reported a relative hyperactivation of the right frontal cortex, which was not found for the parietal cortex (Schaffer, Davidson & Saron, 1983). In their 1990 paper Henriques and Davidson laid a further foundation for the concept of frontal alpha asymmetry in depression (Henriques & Davidson, 1990), where they consider ‘approach’ and ‘withdrawal’ as the essential basis for this asymmetry. “…The approach system facilitates appetitive behavior and generates certain forms of positive affect. The withdrawal system facilitates the withdrawal of an organism from sources of aversive stimulation and generates certain forms of negative affect…” (Davidson, 1998). These two systems have been conceptualized as relatively orthogonal. They interpreted the decreased left-sided frontal activation as a deficit in the approach system, and hence subjects with this condition are more prone to certain negative affective states and depressive disorders, given a certain level of environmental stress. On the other hand, they suggested that the right-sided frontal activation is related to withdrawal related emotion and psychopathology such as anxiety disorders (Henriques & Davidson, 1990). Support for the Approach-Withdrawal model comes from many correlational studies (for an overview see Davidson, 1998) but also from some studies involving manipulation of frontal EEG asymmetry by neurofeedback (Allen, Harmon-Jones & Cavender, 2001; Baehr, Rosenfeld & Baehr, 1997; Choi et al., 2011).
Depression history of EEG and QEEG findings
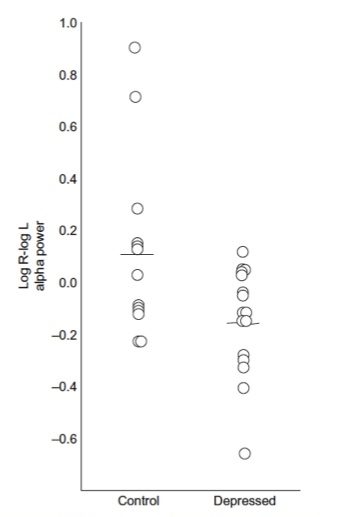
Figure 4: This figure shows the initial results from the Henriques and davidson paper (1990) demonstrating the differences in ‘frontal alpha asymmetry’ between healthy controls and depressed subjects, where the depressed subjects exhibit more relative left frontal alpha, interpreted as dec reased left frontal activity. Note the overlap between these 2 groups.
Besides these frontal deficits Henriques and Davidson (1990) also reported a decreased right-parietal activation found in both previously and currently depressed patients. They related this to selective spatial cognitive deficits which are reported to accompany depression and which might also explain some of the symptoms in affective disorders which require the decoding of non-verbal, expressive behavior (Henriques & Davidson, 1990).
In the often cited Henriques and Davidson (1991) paper, these researchers used data from 15 depressed and 13 controls. They reported significant differences in alpha asymmetry between depressive patients and controls. They reported that only 2/13 normals (15%) deviated significantly from the depressive asymmetry scores and only 1/15 depressives (7%) deviated significantly from the normal asymmetry scores (based on a Cz montage). Therefore, there is more overlap between groups than there are differences – also see figure 4 from the Henriques and Davidson publication showing the individual data. This clearly demonstrates that these data cannot be used for diagnostic and/or prognostic purposes, which is also acknowledged by Davidson (1998) in contrast to the ‘over-interpretation’ of this finding in many QEEG and neurofeedback practices.
Measures of frontal asymmetry in depressed patients are only moderately stable over time (Debener et al., 2000; Tomarken, Davidson, Wheeler & Kinney, 1992), leading the Davidson group to average frontal alpha asymmetry measures over at least 2 occasions (separated by weeks) in their more recent work (Davidson, 1998). Furthermore, eyes open and eyes closed data are also averaged (weighted average) in order to obtain more stable estimates of EEG asymmetry (Davidson, 1998). The finding that this measure is only moderately stable over time has led some authors to question the ‘stable trait’ status of alpha asymmetry (Debener et al., 2000). Most studies investigating the frontal alpha asymmetry did not find any correlation between alpha asymmetry and measures of mood such as depression severity (Debener et al., 2000; Henriques & Davidson, 1991). On the other hand some have suggested that resting frontal alpha asymmetry reflects the joint contribution of a trait that is superimposed on state-like factors (Tomarken et al., 1992). Hagemann et al supported this empirically (Hagemann, Naumann & Thayer, 2001) who found that about 60% of the variance of frontal alpha asymmetry was explained by a latent trait and about 40% was due to state-like fluctuations. Allen et al. (Allen, Coan & Nazarian, 2004) showed that about 60% of the variance in alpha asymmetry is stable across time, despite substantial clinical improvements over time. Finally, several studies have demonstrated that alpha asymmetry was also influenced by differences in cranial and brain parenchymal asymmetries in bone thickness (Myslobodsky et al., 1989) and different EEG montages (Hagemann et al., 2001; Hagemann, Naumann, Becker, Maier & Bartussek, 1998; Reid, Duke & Allen, 1998) whereas Henriques and Davidson (1990) found the effects to be consistent using different EEG montages. In an excellent review of methodological problems with frontal alpha asymmetry measures by Hagemann (2004) many other confounding factors are discussed such as the effect of situational factors (e.g. gender of the experimenter in relation to the gender of the subject, montages, etc.). Furthermore for a good review of structural skull deviations and their potential of confounding frontal alpha asymmetry variables, see Myslobodsky, Coppola & Weinberger (1991).
Depression history of EEG and QEEG findings
Alpha activity is traditionally defined as a sinusoidal rhythm occurring over posterior regions of the brain, which attenuates with eyes open (Chatrian et al., 1974). As Hagemann et al. (2001) suggest, the above-mentioned contradictory findings also may be explained in terms of signal-to-noise ratios. Since alpha activity is not maximal at frontal sites and sometimes there is little to no alpha at those sites, the signal of interest – alpha – can be too low for a reliable estimation of alpha asymmetry. Finally, EEG vigilance could also play a role in some of the contradictory findings since studies measuring short EEG segments (2-3 min.) more often find alpha asymmetry as compared to studies measuring longer EEG segments (e.g. 8 minutes) (Davidson, 1998; Reid et al., 1998). A recent study calculated frontal alpha asymmetry employing personalized alpha bandwidths based on the individual APF (using the same method which is also used in chapter 4), and failed to find a difference in alpha asymmetry between depressed patients and controls by either fixed frequency bands or individualized alpha frequency bands (Segrave et al., 2011).
In summary many studies have investigated the relation between frontal alpha asymmetry and depression, but have demonstrated little value as a diagnostic marker in depression and low heritability (Anokhin, Heath, & Myers, 2006; Smit, Posthuma, Boomsma, & De Geus, 2007). Furthermore, two studies from the same group investigated the prognostic value of alpha asymmetry and found conflicting results (Bruder et al., 2001; Bruder et al., 2008). Hence this measure holds little value in predicting treatment outcome to antidepressant treatment and as Segrave concluded: “…anterior alpha asymmetry lacks the sensitivity to differentiate MDD from controls in the manner of an endophenotype.” (Segrave et al., 2011)
EEG as a prognostic tool: Treatment prediction in depression
Various clinical and demographic characteristics such as ethnicity and age have been found to be related to antidepressant treatment outcome (Trivedi et al., 2006; Kemp, Gordon, Rush & Williams, 2008; Kozel et al., 2008), however the clinical utility of these measures, remains poor and at this moment none of these predictors have clinical use in predicting treatment outcome to various antidepressant treatments (Bagby, Ryder & Cristi, 2002; Simon & Perlis, 2010).
One of the first attempts at using the EEG as a prognostic tool in depression stems from 1957. Roth et al. (1957) investigated barbiturate induced EEG changes (delta increase) and found this predicted to some degree the long-term outcome (3-6 months) of ECT in depression.
In quantitative EEG (QEEG) research, various pre-treatment differences in EEG measures have been reported to be associated with improved antidepressant treatment outcomes. Biomarkers associated with poor antidepressant response which have at least been replicated once include:
- Decreased parieto-occipital alpha power: (SSRI: Bruder et al., 2008; TCA: Ulrich, Renfordt, Zeller & Frick, 1984) and decreased frontal alpha power (Suffin & Emory, 1995).
- Increased Slow EEG power at baseline: Increased Theta (TCA: Knott, Telner, Lapierre, Browne & Horn, 1996), Increased Relative Theta (SSRI & SNRI: Iosifescu et al., 2009) and increased Delta power (SSRI: Knott, Mahoney, Kennedy & Evans, 2000; TCA-trend: Knott et al., 1996). However, Cook et al. (1999) found no differences in theta for responders and non-responders to fluoxetine.
- A slow individual alpha peak frequency (iAPF) for antidepressant medication (Ulrich, Renfordt, Zeller & Frick, 1984) and rTMS treatment (Arns, Spronk & Fitzgerald, 2010; Conca et al., 2000).
- A reduced P300 amplitude (SSRI: Bruder et al., 2001; Bruder et al., 1995; ECT: Ancy, Gangadhar & Janakiramaiah, 1996; Gangadhar, Ancy, Janakiramaiah & Umapathy, 1993). Bruder et al (2001) found that the P300 amplitude was specifically reduced in non-responders at frontal sites (F7, F8, FT9 and FT10) but not at more posterior sites. Furthermore, a prolonged P300 latency has been found to be associated with a poor treatment outcome (Kalayam & Alexopoulos, 1999; Vandoolaeghe, van Hunsel, Nuyten & Maes, 1998).
The above biomarkers are all based on baseline measures. However, in depression much research has also been dedicated to ‘treatment emergent biomarkers’. Treatment emergent biomarkers measure the physiological response to a given treatment and hence at least two assessments are required. These biomarkers are thought to pick up early neurophysiological changes associated with clinical response. Below this is summarized further focusing on ‘EEG Cordance’ and the ‘Antidepressant Treatment Response’ or ATR.
EEG Cordance
The EEG cordance method was initially developed by Andrew Leuchter and colleagues to provide a measure, which had face-validity for the detection of cortical deafferentation (Leuchter et al., 1994). They observed that often the EEG over a white-matter lesion exhibited decreased absolute theta power, but increased relative theta power, which they termed ‘discordant’. Therefore the EEG Cordance method combines both absolute and relative EEG power and negative values of this measure (discordance) – specifically in theta or beta – reflect low perfusion or metabolism, whereas positive values (concordance) – specifically in alpha – reflect high perfusion or metabolism (Leuchter et al., 1994; Leuchter et al., 1994). In a subsequent study they further confirmed this by comparing cordance EEG with simultaneously recorded PET scans reflecting perfusion (Leuchter, Uijtdehaage, Cook, O’Hara & Mandelkern, 1999).
In a first study it was found that depressive non-responders to an SSRI were characterized by a ‘discordant’ brain state at baseline – reflective of low perfusion (Cook et al., 1999). Subjects were classified as ‘discordant’ if >30% of all electrodes exhibited discordance or if fewer electrodes that are highly deviant. Furthermore, central (Cz, FC1, FC2) theta cordance was related to treatment outcome after ECT (Stubbeman et al., 2004). More recent studies have focused on EEG Cordance in the Theta frequency band at pre-frontal electrodes (Fp1, Fp2, Fpz) and have essentially found that the change in Theta Cordance (decrease) after being medicated for 48 hours to 2 weeks predicted longer-term treatment outcome (SSRI & SNRI: Cook et al., 2002; Cook et al., 2005). In an independent replication Bares et al. (2008; 2007) also found that responders were characterized by a decrease in prefrontal (Fp1, Fp2, Fz) Theta cordance after 1 week (Bares et al., 2007: SSRI, SNRI, TCA; Bares et al., 2008: SNRI).
Pre-frontal Theta Cordance increase was found in placebo-responders (Leuchter, Cook, Witte, Morgan & Abrams, 2002). A more recent study from this group refined this further by examining right-medial frontal sites (FPz, Fz, FP2, AF2, F4 and F8) and found that Theta Cordance after 1 week of treatment was only decreased in the medication remitters but not in the placebo-remitters (Cook, Hunter, Abrams, Siegman & Leuchter, 2009), hence demonstrating specificity of this measure related to treatment outcome only and not to placebo response.
ATR: Antidepressant Treatment Response
The ATR measure was also developed by Andrew Leuchter (Leuchter et al., 2009; Leuchter et al., 2009) and Iosifescu (2008) and is commercialized by Aspect Medical Systems. The first results of this measure were published by Iosifescu et al. (2009), demonstrating the ATR measure was able to predict treatment outcome to an SSRI or Velafaxine with an accuracy of 70% (82% sensitivity; 54% specificity). Recently the results of a large clinical trial (BRITE-MD) investigating the ATR were published. This measure is based on EEG recorded from Fpz (FT7 and FT8) and is the non-linear weighted combination of 1) combined relative alpha and theta (3-12 Hz/2-20 Hz) at baseline and 2) the difference between absolute alpha-1 power (8.5-12 Hz) at baseline and absolute alpha-2 power (9-11.5 Hz) after 1 week of treatment (Leuchter et al., 2009). It was demonstrated that a high ATR value predicted response to an SSRI with 74% overall accuracy (58% sensitivity, 91% specificity; Leuchter et al., 2009). Interestingly, in another study, they reported that patients with a low ATR responded better to the atypical antidepressant Bupropion which has a clear dopaminergic affinity (Leuchter et al., 2009) thereby demonstrating this measure identified 2 sub-groups of depressive patients with subsequent implications for 2 types of antidepressants with a different mode of action.
The disadvantage of this method is that patients already need to be prescribed the medication before any prediction can be made and this method could not be used on 15% of the patients due to ECG artifacts (Leuchter et al., 2009).
Summarizing, at this moment there is a lot of promising research demonstrating that there are EEG measures which might predict treatment outcome to antidepressant treatments. However, none of these baseline measures have achieved a level of research warranting its use in clinical practice. Most likely for this purpose an integrative approach is required using data from multiple domains such as EEG, ERP, neuropsychology and genetics as a recent pilot-study demonstrated (Spronk, Arns, Barnett, Cooper & Gordon, 2011). Furthermore, at this moment given the wealth of data there is a need for a theory or model which integrates these findings and can make better predictions on the use of EEG in predicting treatment outcome and explaining the relationship between such EEG predictors and the behavioral complaints in depression and ADHD.
Depression history of EEG and QEEG findings